If you are experiencing an issue with the Cyblock Proxy and adding new Outlook profiles please view the following link from Microsoft for steps to attempt to resolve the issue:
Administration
Customers currently running CyBlock Version 9.2.8 may now upgrade to CyBlock Version 9.4.x. This new version consists of two components, CyBlock and a metric server database, that run in VM environments–VMware and Hyper-V. Customers have a choice of two upgrade options.
Option 1: Upgrading an Existing CyBlock Install
- Contact support to upgrade your existing CyBlock install to the latest version, currently v9.4.x.
- Install the metric server on either a VMware or Hyper-V platform.
Option 2: Installing a New CyBlock VM Version
- Install both CyBlock v9.4.x and the metric server on either a VMware or Hyper-V platform.
- Use our Sync tool to transfer your core configuration settings to the new version of CyBlock.
Note: Both options will require a reimport of your log data.
When you are ready to upgrade, Technical Support will be on hand to get you up and running. If you have any questions, please contact Technical Support at (321) 953-5351, Ext. 4 or support@wavecrest.net.
Enhancements
- Network Segments
- Assign IP address blocks based on reasons such as remote VPN users, public WiFi, corporate WiFi, different departments or physical location in the facility.
- Easily define a unique segment definition by single hostname, IP address range or by IP subnet.
- Report on specific segments through dashboard charts or actual reports.
- Customize charts and reports to include or exclude traffic from segmented IP addresses.
- Create a specific row-level filter or run a report with a global-level filter that will affect all the data.
Corrects
- Dashboard – Palo Alto Traffic
- Corrected chart configuration selection not rendering properly.
Enhancements
- Network Segments
- Assign IP address blocks based on reasons such as remote VPN users, public WiFi, corporate WiFi, different departments or physical location in the facility.
- Easily define a unique segment definition by single hostname, IP address range or by IP subnet.
- Report on specific segments through dashboard charts or actual reports.
- Customize charts and reports to include or exclude traffic from segmented IP addresses.
- Create a specific row-level filter or run a report with a global-level filter that will affect all the data.
Corrections
Enhancements
User Interface Libraries
- Updated jQuery library version to remove security vulnerabilities.
Wavecrest is excited to share more information about upgrading your Cyfin. The latest Cyfin VM will open up your Web reporting capabilities to be easier and much more useful than ever before!
We have expanded Cyfin’s machine-learning algorithms, substantially improving the visit filter and time online calculation and providing faster data retrieval, bringing you superior data insights that are more actionable than ever before.
The expansion of the reporting features also includes expanded fields to report on! To us manager ready means easy and understandable for everyone. We have added a new tagging field provides a friendly name for sites visited. Managers do not need to dig through firewall data to get to the information they need, making the report much easier for every manager, admin, HR, and others to interpret.
Our new Custom Reporting feature has also become one of our new faves. Every business is different, and that means they want different information, different formats, and at different times. Cyfin’s Custom Reports allows you more control by giving you easy drag-and-drop tools to build tailored reports for different departments, run these reports ad hoc, allow managers access to their data while using your customized templates, and more. All to provide you flexibility for reports that specifically fit your company’s unique needs.
We have also focused on becoming even more user-friendly, low maintenance, and sensitive to IT time constraints. Cyfin is now much more scalable, with easier processes to expand the metric server cluster and distribute the processing, as well as making it easier to manage system resources for both Cyfin and metric server/s.
We are not stopping there. With the new Cyfin environment the sky’s the limit. It has opened up our ability to work on what you need almost to the point of customizing it for you!
A peek of just a few things we have up our sleeves:
- Geolocation report that provides the country of the websites your employees’ visited
- Improved search term reports
- Improved user agent report
Based on the advances in the technology and the increase and speed of features, we recommend you upgrade to the latest version of Cyfin. Even though we feel the upgrade is relatively straightforward please know that Support will spend as much or as little time with you as you deem necessary! We are here for you, so please ask any questions or request any other information!
Customers currently running Cyfin Version 9.2.8 may now upgrade to Cyfin Version 9.5.x. This new version consists of two components, Cyfin and a metric server database, that run in VM environments–VMware and Hyper-V. Customers have a choice of two upgrade options.
Option 1: Upgrading an Existing Cyfin Install
- Contact support to upgrade your existing Cyfin install to the latest version, currently v9.5.x.
- Install the metric server on either a VMware or Hyper-V platform.
Option 2: Installing a New Cyfin VM Version
- Install both Cyfin v9.5.x and the metric server on either a VMware or Hyper-V platform.
- Configure Cyfin to read your existing log files before log data can be imported.
- Use our Sync tool to transfer your core configuration settings to the new version of Cyfin.
Note: Both options will require a reimport of your log data.
When you are ready to upgrade, Technical Support will be on hand to get you up and running. If you have any questions, please contact Technical Support at (321) 953-5351, Ext. 4 or support@wavecrest.net.
To configure your Cisco ASA with FirePOWER firewall to send web traffic syslog messges to your syslog server, you need to define the syslog server and apply syslog logging to your access control and SSL policies.
Define Syslog server in Cisco ASA w/FirePOWER
- To configure a Syslog Server for traffic events, navigate to Configuration | ASA Firepower Configuration | Policies | Actions Alerts and click the Create Alert drop-down menu and choose option Create Syslog Alert.
- Enter the following values for the Syslog server installed (see step 1 above).
- Name: Specify a name to uniquely identifies your Syslog server such as ‘Kiwi Syslog Server’
- Host: Specify the IP address/hostname of the Syslog server.
- Port: Specify the port number your Syslog server is listening on. 514 is the default syslog server port.
- Facility: Select any facility such as SYSLOG
- Severity: Select Informational
- Tag: Leave blank.
Apply Syslog to Access Control Policies
- Select Configuration | ASA FirePOWER Configuration | Policies | Access Control Policy.
- On the Rules tab, click the Edit icon next to the access control policies that apply to your network’s Internet usage. For each policy:
- Go to the Logging tab and select Log at Beginning and End of Connection
- In the Send connection events to section, check Syslog and select your syslog server (defined above)
- Click OK.
- Select the Advanced tab and click the edit icon next to General Settings.
- Change the Maximum URL characters to store in connection events to 4096 (this is the maximum number of characters to store for URLs) and click OK.
- Click Store ASA FirePOWER Changes to save your changes.
Apply Syslog to SSL Policies
- Select Configuration | ASA FirePOWER Configuration | Policies | SSL
- On the Rules tab, click the Edit icon next to the SSL policies that apply to your network’s Internet usage. For each policy:
- Go to the Logging tab and select Log at End of Connection
- In the Send connection events to section, check Syslog and select your syslog server (defined above)
- Click OK.
- Click Store ASA FirePOWER Changes to save your changes.
Cyfin Syslog server should start receiving log messages and logging them to text files.
Additional Resources
- Wavecrest Video on setting up Syslog in Cyfin: Cyfin Syslog Setup Video
In Cyfin version 9.3.1, the Log Data Source Setup wizard has been redesigned to improve the configuration of the product to locate and read your Web-use data when it is syslog data, log files, or database logs. The system will analyze your data to detect the data source format and present the most suitable data types. This allows you to select the best data type from the list and ensures that you get the best match available.
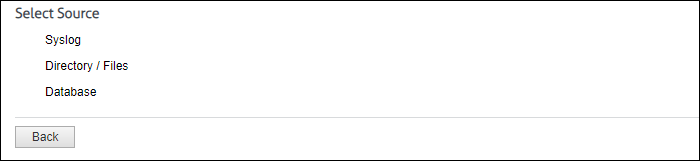
You will be able to select from the following data sources: syslog, directory-based, and database.
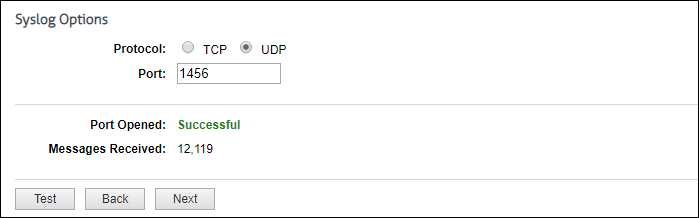
For syslog data, select the Internet protocol you want to use, and enter the listening port number. Click Test to start collecting data. If this is successful, you will see the number of messages received incrementing. Click Stop and then Next to continue.
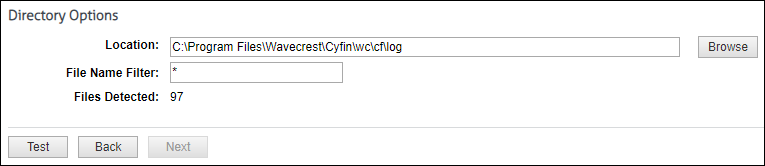
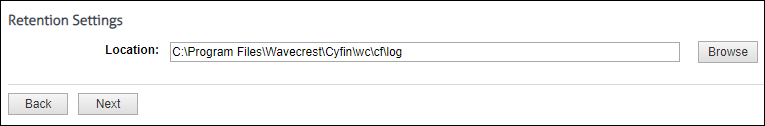
For directory-based or log file data, specify the directory location of your data files. You can also enter a file name with an asterisk to filter your log files, e.g., proxy*.txt. Click Test to display the number of files found. Click Next.
The Data Source Type page is displayed.
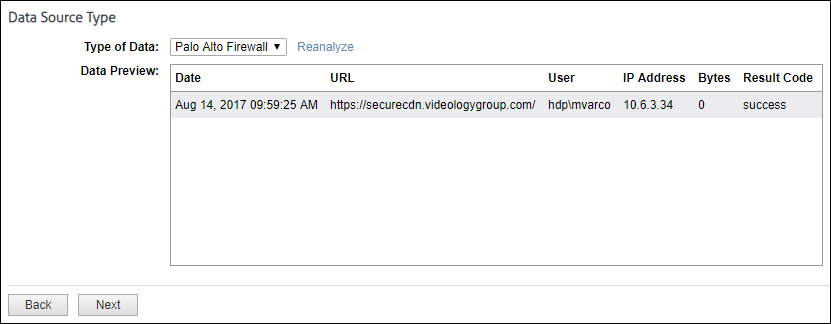
The Type of Data drop-down field will display multiple matches. As you select a data type, the data format will be shown in the Data Preview box. Look closely at the data fields to ensure that they are correct or complete.
- You may see incomplete data, for example, if you were expecting a user name and it is missing. Click Reanalyze to see another record sample.
- If you need to refresh the data for any reason or are still in the process of receiving syslog messages, click Reanalyze and then select the data source type again.
- If your firewall is not in the drop-down field, but the data of another completely matches and is in the correct columns, you may select that firewall even though it has a different name. Some firewalls share common data formats.
- If no matches are found, all syslog and directory data types will become available in the drop-down field. You can select a different data type from the field to complete the configuration process and return at a later time to change it.
- It is easy to add new data sources to our extensive library. If you have a new data source, need assistance with multiple matches, or have no matching files, just contact Technical Support.
Also for Syslog, you can specify a location in which to keep a local copy of your data.
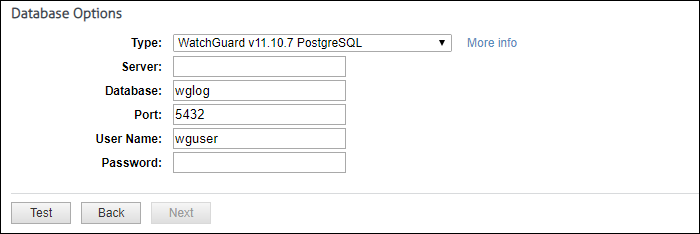
For database data, the system loads and populates the Type field with database data types. The “More info” link provides setup information on your specific database. Select the type of database and complete the remaining fields. Some fields will be populated with default values.
The last step is to give the data source configuration a name. This is helpful for identification purposes, especially if you add more data source configurations later.
If you have any questions, please contact Technical Support at (321) 953-5351, Ext. 4 or support@wavecrest.net.
Zscaler uses a virtual machine, Nanolog Streaming Service (NSS), to stream logs from the Zscaler service and deliver them to Cyfin Syslog.
To collect logs for Zscaler Web Security, perform these steps detailed in the following sections:
- Configure Zscaler NSS.
- Connect the Zscaler NSS feed to Cyfin Syslog.
Configure Zscaler NSS
NSS is maintained and distributed by Zscaler as an Open Virtual Application (OVA). To stream logs to Cyfin Syslog, follow the steps outlined in the NSS Configuration Guide at https://support.zscaler.com/hc/en-us…guration-Guide.
Connect the Zscaler NSS Feed to Cyfin Syslog
Once you have configured the Zscaler NSS, now add a feed to send logs to Cyfin Syslog using the following steps.
- Log into your Zscaler NSS system.
- Go to Administration – Settings – Nanolog Streaming Service.
- From the NSS Feeds tab, click Add.
- In the Add NSS Feed dialog:
- Feed Name. Enter a name for your NSS feed.
- NSS Server. Select None.
- SIEM IP Address. Enter the Cyfin IP address.
- Log Type. Select Web Log.
- Feed Output Type. QRadar LEEF is the default.
- NSS Type. NSS for Web is the default.
- Status. Select Enabled.
- SIEM TCP Port. Enter the Cyfin Syslog TCP port number.
- Feed Escape Character. Leave this field blank.
- Feed Output Format. The LEEF format is displayed.
- User Obfuscation. Select Disabled.
- Duplicate Logs. Disabled by default.
- Timezone. Set to GMT by default.
- Click Save.
Additional Resources
- Wavecrest video on setting up Cyfin syslog: Cyfin Syslog setup video