Skip to content Skip to main navigation Skip to footer

Blog

Product Update Notice

Wavecrest is excited to announce that a major release is available. When you are ready to upgrade, Technical Support will be on hand to get you up and running.

Here are some of the features!

  • Smart Engine. The new Smart Engine allows greater flexibility in the way Dashboard charts and reports are generated with metrics, such as Visits and Time Online. The Smart Engine replaces the need for the Derby, MySQL, and SQL Server dashboard databases.
  • Metric Server. The metric server settings are displayed on the Configuration Settings screen. They connect the product to the metric server to extract the data for the Dashboard charts and Time Online Analysis report.
  • Dashboard Custom Charts
    • The new Custom charts give you a customizable overview of the Web activity of your top consumers as well as any trends in Internet activity. They provide drill-down capability to generate appropriate detailed audit reports.
    • Top chart data can be grouped by users, groups, categories, classifications, sites, or user agents and displays the top 10 results in a bar chart or a pie chart. For bar charts, the data can be further subgrouped by users, groups, categories, classifications, sites, or user agents.
    • Trend chart data can be grouped by users, groups, categories, classifications, or traffic. These time series charts allow you to view the data for a selected user, a group, the top 10 categories or a single category, and one or more classifications, as well as allowed and denied traffic. You may also compare the Web traffic for a predefined date range with a previous period to detect any anomalies in Web activity.
  • Top Charts. In the predefined Top charts, a Subgrouping field allows you to further subgroup data by users, groups, categories, classifications, sites, or user agents. The drill-down report will be appropriate to the selected Top chart, metric, or subgrouping. For example, if the selected metric is Time Online, the drill-down report will be the Time Online Analysis Report.
  • Trend Charts. In the Trend Categories chart, a new category “Top 10” is available.
  • Palo Alto Traffic Charts (Cyfin)
    • Dashboard charts will be available for Palo Alto Traffic logs that show the Web activity of your top consumers as well as any trends in Internet activity measured in bytes. The available metrics are Total Bytes, Bytes Received, Bytes Sent.
    • Similar to Custom charts, Top chart data can be grouped and subgrouped by users, groups, Palo Alto categories, applications, protocols, countries, or actions, and is displayed in a bar chart or a pie chart. Trend chart data can be grouped by users, groups, Palo Alto categories, applications, protocols, countries, or actions. These time series charts allow you to view the data for a selected user, group, or individual or top categories, applications, protocols, countries, or actions. Comparison Trend charts compare the Web traffic for a predefined date range with a previous period.
  • Manager Access to Dashboard Charts. Managers can now view the Web activity of their authorized users on Dashboard charts. These include the customizable and predefined Top and Trend charts.
  • Print Style Sheet for Charts. Charts can now be printed from the browser without extraneous text printing. Printing should only include the page title and the chart. Print dialog options include Headers and footers and Background graphics which displays the product logo. Note that some browsers may print a blank second page or print the chart on more than one page. This is a browser issue.
  • Multiple Log File Configurations (Cyfin). On the Dashboard charts, if there is more than one log file type configured in Cyfin, the Data Configuration field is displayed to allow you to choose a single configuration or all configurations to show that data on the chart.
  • Time Online Analysis Report. The report shows the amount of time spent accessing Web sites by user, group, or Enterprise from the following different perspectives: classification (Acceptable, Unacceptable, and Neutral), category, user per category, and hour.
  • Sample Reports. The sample Site Analysis and User Audit Detail Reports have been replaced with reports with more data.
  • Syslog Log File Configurations (Cyfin). In Log Data Source Setup, a new folder can be added to the Directory path for syslog log file configurations if syslog is enabled. If you add a new folder name to the path and the Enable Syslog Server check box is selected, the folder will be created.
  • Login Name Caching (Cyfin)
    • For synchronous logs, the product will use the cache user name, if available, for records that that do not include the user name, versus the IP address, allowing you to get more detailed data in reporting.
    • You can set the maximum elapsed time between the authenticated traffic and unauthenticated traffic. After this length of time, the IP address will be used.
  • Active Directory Manager Grouping Type. The ability to import from Active Directory based on the Manager field has been added. This allows AD logon accounts to be imported for each manager.
  • Log File Removal. On the Data Management – Log Data Source – Delete screen, a “2 Weeks” option has been added to the Storage Limit field allowing you to delete raw log files or raw syslog log files older than 2 weeks.

Configuring log forwarding from Palo Alto Panorama to Cyfin Syslog Server

With your firewalls already forwarding logs to Panorama, the high-level steps to forward Palo Alto Panorama logs to Cyfin Syslog Server include the following:

  • Configure the server profile that defines how Panorama and Log Collectors connect to the external service, that is, Cyfin Syslog Server.
  • Assign the server profile to the log settings of Panorama and to Collector Groups.

STEP 1: Configure a server profile for Cyfin Syslog Server that will receive log information.

  1. Select Panorama – Server Profiles and select Syslog.
  2. Configure the syslog server profile.

STEP 2: Configure destinations for:

  • Logs that the Panorama management server and Log Collectors generate.
  • Firewall logs that a Panorama virtual appliance in Legacy mode collects.
  1. Select Panorama – Log Settings.
  2. Add one or more match list profiles for each log type.

The profiles specify log query filters, forwarding destinations, and automatic actions such as tagging. For each match list profile:

    1. Enter a Name to identify the profile.
    2. Select the Log Type.
    3. In the Filter drop-down field, select Filter Builder. Specify the following and then Add each query:
      • Connector logic (and/or)
      • Log Attribute
      • Operator to define inclusion or exclusion logic
      • Attribute Value for the query to match
    4. Add the server profile you configured for Cyfin Syslog Server.
    5. Click OK to save the profile.

STEP 3: Configure destinations for firewall logs that Log Collectors receive.

  1. Select Panorama – Collector Groups and edit the Collector Group that receives the firewall logs.
  2. Select Collector Log Forwarding and see step Add one or more match list profiles for each log type above.
  3. Click OK to save your changes to the Collector Group.

STEP 4: Commit and verify your configuration changes.

  1. Select Commit – Commit and Push to commit your changes to Panorama and push the changes to device groups, templates, and Collector Groups.
  2. Verify that Cyfin Syslog Server is receiving the log information in one of the following ways:
    • In the log folder, check for the syslog.txt file.
    • In Cyfin, go to Data Management – Log Data Source – Viewer to check for syslog.txt.

Additional Resources:

E-mailing reports with an Office 365 account

If the administrator’s e-mail address is an Office 365 account and you are experiencing an issue when e-mailing a report from Reports – Manager, Option 2 in the following article may resolve the issue:

How to set up a multifunction device or application to send email using Office 365

In the Step-by-step instructions for direct send section of the article, note the MX record POINTS TO ADDRESS value, and enter it in the Server Name field on the Settings – E-Mail screen in the product. Run the report again with the E-Mail Report Delivery option.

If you have any questions, please contact Technical Support at (321) 953-5351, Ext. 4 or support@wavecrest.net.

Excluding Office 365 URLs from reports

If Office 365 URLs are showing in the Personal E-Mail category in reports and you want to exclude them from the reports, run a Category Audit Summary report to identify the specific Office 365 URLs. Use these URLs in one of the following ways to exclude them from reports.

Add URLs to a custom category

  • Go to Categorization – Customize – URLs to create a custom category.
  • Add the Office 365 URLs to be excluded to the custom category and submit your change.
  • Go to Categorization – Customize – Categories and set the custom category to “Off.”
  • Submit your change. The URLs should no longer appear on reports for new log files.

Note:  Imported data is not affected, that is, the URLs will still show from previously imported data. You may delete and reimport the data to exclude these URLs.


Add URLs to PAC file exceptions (CyBlock)

  • Go to Settings – Proxy – PAC File.
  • Under IP/Domain Exceptions, add the Office 365 URLs that you want to exclude from going through the proxy.
  • The URLs will be excluded from Web traffic and hence, not appear on reports.


Add URLs to browser exceptions

  • Internet Explorer
    • Go to Tools – Internet options – Connections – LAN settings.
    • If Internet Explorer is configured to go through the proxy, the Use a proxy server for your LAN check box may already be selected.
    • Click Advanced.
    • In the Exceptions box, enter the URLs to exclude.
  • Chrome (uses system settings by default)
    • At the top-right of the browser, click the Customize and control Google Chrome icon and select Settings.
    • At the bottom, click Show advanced settings…
    • Scroll down to Network and click Change proxy settings…
    • Click LAN settings and follow the instructions for Internet Explorer above.
  • Firefox
    • At the top-right of the browser, click the Open menu icon and select Options.
    • Go to Advanced – Network – Connection and click Settings.
    • If Firefox is configured to go through the proxy, the Manual proxy configuration option may already be selected.
    • In the No Proxy for box, enter the URLs to exclude.
    • Alternately, if you already have proxy settings configured in Internet Explorer, you can select Use system proxy settings.

Cyfin VM support

For the Cyfin VM deployment, the .ova files were created with VMware. Cyfin VM supports ESXi 6.0, ESXi 5.5, and ESXi/ESX 4.x. Ensure your hardware is compliant with the VMware requirements for your particular solution for optimal performance and reliability.

If you have any questions, please contact Technical Support at (321) 953-5351, Ext. 4 or support@wavecrest.net.

Supporting Chromebooks

The operating system, Chrome OS 57, is supported and works with CyBlock and Cyfin. This operating system is used on Chromebooks.

For CyBlock, you can set the proxy in a Chromebook’s network connection settings in one of the following two ways:

Unable to see Web site hits information in SonicWall

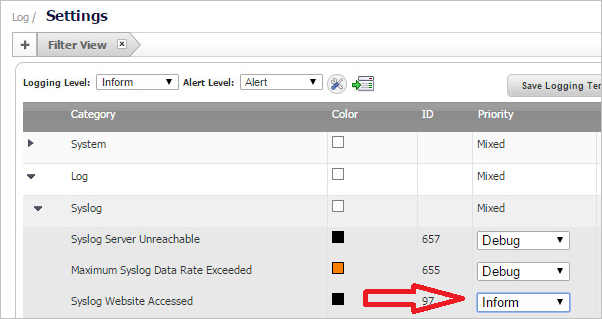
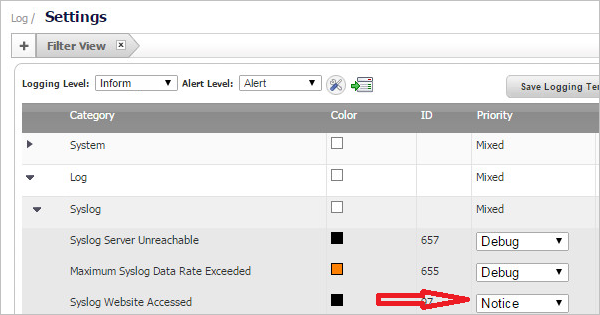
In SonicWall, if the Content Filtering Service (CFS) is enabled, but the log file is not receiving Web traffic data and therefore not showing as valid in Cyfin, then you need to check the Priority setting for “Syslog Website Accessed.”

  1. Go to Log – Settings and set the Logging Level field to “Inform.”

  1. Then under Category, go to Log – Syslog – Syslog Website Accessed.

  1. Adjust the priority to match the selected logging level.

  1. The log file should now receive Web traffic data and show as valid in Cyfin.

Additional Resources

What are the log file fields needed by Cyfin?

Cyfin needs certain log file fields to process your logs. The following log file fields are required:

  • Date/Time
  • URL – If the file contains the protocol, domain/host name, and path separately, the URL can be created from these fields.
  • IP Address

In addition, the following optional fields are optimal for more detailed reporting:

  • User
  • Size/Bytes
  • Reason/Status

If you have any questions, please contact Technical Support at (321) 953-5351, Ext. 4 or support@wavecrest.net.