Skip to content Skip to main navigation Skip to footer

Reporting

Cannot log on to interface after interactive report password reset

This information applies to version 9.2.4 and earlier. Version 9.2.5 and later resolve this issue.

If you are attempting to get to an interactive report and have forgotten the password, DO NOT attempt to reset the password from the interactive report Logon screen. If you have done this and cannot log on with any accounts, please do the following:

  1. Stop the CyBlock/Cyfin service.
  2. Open the following file with a text editor as an Administrator:
    • For CyBlock: …Wavecrest\CyBlock\wc\cyblock\db\accessAccounts.xml
    • For Cyfin: …Wavecrest\Cyfin\wc\cf\db\accessAccounts.xml
  3. Locate the following class:

<new class=”wc.browser.accounts.browserUserAccountData”>
<set username=”report_viewer” />
<set authenticationType=”NO AD” />
<set password=”0x1f1ee81c8d844aebda077ca24d8ce9ca” />
<set temp=”true” />
<set fullname=”Report Viewer” />
<set emailAddress=”first.last@company.com” />
<set homeDir=”C:\TEMP” />
<set accountType=”2″ />
<class allowedGai=”wc.browser.accounts.browserAllowedGaiData”>
</class>

  1. Change true to false.
  2. Save the file.
  3. Start the CyBlock/Cyfin service.

You should now be able to log on to the interface once again. If you are still seeing issues, please contact Technical Support at support@wavecrest.net.
Reporting on cloud service activity

Providing a number of cloud service categories, CyBlock/Cyfin categorizes your cloud applications and services and allows you to assess their usage through cloud service reporting. Cloud service categories include Audio Streaming, Cloud Infrastructure, Cloud Storage, Collaboration, CRM, Development, File Sharing, HR, Personal E-Mail, Video Streaming, and VoIP Services.

On the Reports Selection page, in the Cloud Services Reports section, two report templates allow you to generate reports on only cloud service categories.

  • Cloud Services Detail
    • This is a low-level report that shows the specific URLs of cloud services by user, that is, visits to only the cloud service categories. It provides management with a complete view of every cloud service URL the user has clicked. This information can be used for cloud usage audits, identifying the most active users and the most heavily visited sites.
  • Cloud Services Summary
    • This is a high-level report that shows employee Web use of cloud services. It indicates by user the number of visits to sites in the cloud service categories. Information is presented by category and by individual user. The report can be used to identify cloud service usage patterns, better manage cloud subscriptions, and highlight abnormal activity.

Reports Manager appears blank

If the Reports – Manager screen in Cyfin or CyBlock is blank, that is, there are no reports for you to select, the Reports Manager has most likely become corrupt.

To restore the Reports Manager, do the following:

  1. Go to Settings – Restore Points – Download.
  2. Click a date on which the Reports Manager was working to download that restore point.
  3. Save the restore point.
  4. Uncompress the restore point folder.
  5. For Cyfin, go to the …\cf\reports directory.
  6. For CyBlock, go to the …\cyblock\reports directory.
  7. Copy the system folder from the uncompressed restore point.
  8. Stop the CyBlock or Cyfin service.
  9. Go into your local install folder for the product:
    • For Cyfin: …\Wavecrest\Cyfin\wc\cf\reports
    • For CyBlock: …\Wavecrest\CyBlock\wc\cyblock\reports
  10. Rename the local system folder in this directory (OLDsystem).
  11. Paste the system folder that you have copied from the restore point.
  12. Start the CyBlock or Cyfin service.

After these steps, check your Reports – Manager screen to see that it is no longer blank. If it is, please contact Technical Support.

CyBlock/Cyfin forcing memory increase after running a report

If you are running a low-level audit detail report on a group and not on just users, you may be required to increase the product memory in CyBlock/Cyfin. This is due to the reporting engine attempting to run a report on each user in the group all at once, instead of one after the other.

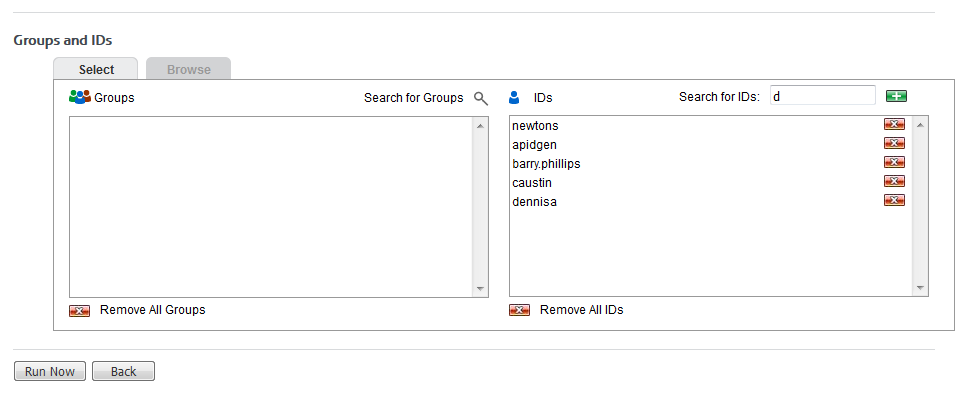
The recommended way of running low-level reports is to highlight the group(s) and then select the users in the IDs box under Groups and IDs, making sure no groups are selected in the Groups box. See the example below.

lowLevelUserReport


How to interpret cloud report dates/times for your time zone

In Wavecrest reports, dates and times are displayed in several places, such as in the Report Request Parameters–Current Date/Time, Report Start Date/Time, and Report Stop Date/Time. In addition, in Audit Detail reports, all hits including visits have a date and time associated with each URL that is displayed.

Cloud Customers

For cloud customers who are using a CyBlock Cloud instance that is not located in their local time zone, the dates/times in reports are specific to the time zone set in your cloud account, that is, the time zone in which your Web activity is occurring.

For example, if you are in Pacific Time, running a User Audit Detail report for the selection, Previous 24 Hours, and going through central.cloud.cyblock.com which is in Central Time, the URLs in the report would have times of your local time if this time zone is set in your cloud account. So if the date is Sep 11 and your local time is 11:02 a.m., “Previous 24 Hours” would be Sep 10, 11:00:00 a.m. to Sep 11, 10:59:59 p.m. in Pacific Time, and the URL times would span this time period.

The dates and times in the report e-mail will also reflect the time zone set in your cloud account.

Hybrid Cloud Customers

For Hybrid cloud customers, reporting is based on your local CyBlock instance time. Reports will show all traffic as it occurred in the time zone of each of your cloud accounts for the same local CyBlock instance time. When running reports for all cloud accounts, managers can see traffic for all time zones at the same time and hour.

For example, if your local CyBlock instance time is Eastern Time, cloud Web activity is in Central Time and Mountain Time, and you are running a Site Analysis report for 10:00 a.m. for all configurations, the report will show 10:00 a.m. Central Time traffic and 10:00 a.m. Mountain Time traffic.

If you have any questions, please contact Technical Support at (321) 953-5351, Ext. 4 or support@wavecrest.net.

What are zero-byte visits in audit detail reports?

When viewing an audit detail report, the number of bytes received from the Internet in response to Web requests is shown in the Size column in the Audit Detail section of the report. It includes all content that was used to render the Web site, which is referred to as “payload,” but does not include the accompanying HTTP header information. HTTP headers contain information about the request or response that allows servers to provide the right data and browsers to render the content properly. Occasionally, servers can respond with only HTTP header information to inform the browser that there is no content, or redirect to a new URL for the content. These visits show in the audit detail report as zero bytes (0 B) in the Size column. While there is no payload for these requests, they are valid entries in the report because the browser requested the data and received a valid HTTP response.

If you have any questions, please contact Technical Support at (321) 953-5351, Ext. 4 or support@wavecrest.net.

Converting older scheduled reports to the new UI

This applies to CyBlock Software and Cyfin.

When upgrading an older version 6.x.x/8.x.x of the product to the newer version 9.x.x, scheduled reports may not convert to the new user interface in some cases. Customers should send their …\wc\[cf|cyblock]\db\sched folder to Technical Support.

To upgrade to the latest version, please contact Technical Support at (321) 953-5351, Ext. 4 or support@wavecrest.net.

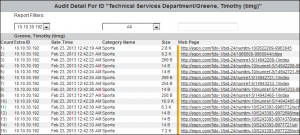
Using the audit report filters

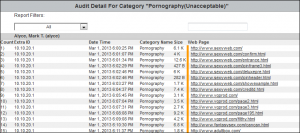
In audit detail reports, report filters allow you to filter data by user, IP address, category, search term, and URL. The filters are located in the Audit Detail section of the report. If only one user or one category exists in the report, the corresponding filter field will not be displayed. For example, a Category Audit Detail report provides data on one category at a time, and therefore, the category filter field will not be displayed.

The following reports contain filters:

  • Category Audit Detail
  • Denied Detail
  • Legal Liability Detail
  • Search Terms Audit Detail
  • Site Audit Detail
  • User Audit Detail

The following filters are available depending on the report:

  • The user filter field shows all users in the report. When you make a selection, the report shows only data for that user.
    • In the User Audit Detail report, this field shows IP addresses. If there is only one IP address associated with the user, the filter field will not show.
  • The category filter field shows all categories in the report. When you make a selection, the report shows only data for that category.
  • A text field lets you enter URL text to filter on. You do not have to type the full URL. The report shows only data with URLs containing the entered text.
    • In the Search Terms Audit Detail report, you would enter a search term or search term phrase to filter on. The report shows only data with the entered search term or search term phrase.

Below is an example of a User Audit Detail report.

For additional assistance, please contact Technical Support at (321) 953-5351, Ext. 4 or support@wavecrest.net.

Using the Cyfin Syslog Server

This information applies to version 9.3.0 and later.

Our Cyfin product allows you to send syslog data to the Cyfin Syslog Server that can then be read by Cyfin. Customers no longer have to install and configure a syslog daemon. You will need to configure your gateway device to direct syslog output to the Cyfin Syslog Server at a configured port.

  1. Go to Data Management – Log Data Source – Setup to create or modify your syslog log file configuration.
  2. Choose from the following:
    • Astaro Security
    • Barracuda Networks
    • Bloxx Proxy
    • Check Point Syslog
    • EdgeWave iPrism
    • FortiGate
    • McAfee Web Gateway Syslog
    • NETGEAR
    • Palo Alto Firewall
    • SonicWall Security Appliance
    • Sophos
    • WatchGuard Syslog
  1. Select Enable Syslog Server, select the port type, and enter a listening port number. The Syslog Filter field is prepopulated with the default value format based on your syslog configuration. It is used to log only the pertinent data into the syslog and not all the data that is being sent.

  1. Once the Cyfin Syslog Server receives data, it will confirm success at parsing the syslog data based on the selected log file type. If there is an issue with the log file validation, your data can be sent to Technical Support for resolution.

For additional assistance, please contact Technical Support at (321) 953-5351, Ext. 4 or support@wavecrest.net.

Additional Resources:

Error: no data found (reports)

If reports are empty and returning an error, there are a few things to check.

  • Are the logs for your selected time frame valid? (Data Management – Log Data Source – Viewer¹).
  • If utilizing the Report Database, have logs for your selected time frame been imported? (Data Management – Report Database – Viewer²).
    – (If raw logs are valid but have not been imported, you can manually import them by going to Data Management – Report Database – Import – Manual³.)
  • Be sure that users are correctly configured to go through the proxy.


¹ Versions 6.8.3a/8.8.3a and earlier: Logfiles – Viewer

² Versions 6.8.3a/8.8.3a and earlier: Logfiles – Data Manager – Import Data – Viewer

³ Versions 6.8.3a/8.8.3a and earlier: Logfiles – Data Manager – Import Data – Import – Manual