Skip to content Skip to main navigation Skip to footer

Reporting

Finally—Clarity from the Chaos of Firewall Logs

How Cyfin Delivers Actionable Employee Web Activity Reports from Complex, Noisy Firewall Data

Executive Summary

Organizations rely on firewalls to secure their networks, but these tools generate logs that are incredibly complex. Every device, system update, browser tab, and cloud sync creates a connection—and every connection gets logged. For IT, HR, and management teams trying to understand actual employee behavior online, these logs present a mess of indistinguishable data. Cyfin changes that.

Cyfin is a powerful log-parsing and reporting engine that reads raw, connection-based firewall logs and delivers clear, human-readable reports focused on employee-initiated web activity. It cuts through the noise—from Windows updates to endpoint security traffic—and delivers reports designed for both technical and non-technical audiences.

Why Cyfin is Different

Most tools tell you everything that happened on the network. Cyfin tells you what your employees did.

Firewall logs don’t distinguish between a user browsing a news site and their machine syncing with a cloud service. Cyfin’s core strength is its ability to recognize and separate human-initiated actions from the flood of background traffic that is increasingly using the same web protocols and ports.

This distinction is essential. Whether you’re conducting an internal investigation, responding to a compliance request, or simply monitoring productivity, Cyfin gives you the clarity you need to make decisions based on facts, not assumptions.

Key Benefits

  1. Accurate Employee Web Usage Monitoring
    • What It Does: Filters out non-human activity to focus solely on employee-initiated web actions.
    • Why It’s a Game-Changer: Standard firewall reports lump everything together, distorting the picture of employee behavior. Cyfin ensures accuracy by isolating what matters.
    • For IT: Automates log analysis, reducing your workload and delivering precise data.
    • For HR & Management: Delivers a true view of employee web use—perfect for enforcing policies or boosting productivity.
  2. Simplified Compliance and Security
    • What It Does: Produces detailed, auditable reports to meet regulations (e.g., GDPR, HIPAA) and spot security risks.
    • Why It’s a Game-Changer: With remote work and data privacy laws on the rise, Cyfin’s reports provide compliance-ready evidence and threat detection.
    • For IT: Seamlessly integrates with your firewall setup for efficient monitoring.
    • For HR & Legal: Offers easy-to-use reports tailored to your compliance needs, simplifying audits.
  3. No Software on Employee Devices
    • What It Does: Monitors activity directly from firewall logs—no agents needed on individual devices.
    • Why It’s a Game-Changer: Cuts deployment hassle, reduces privacy concerns, and works across all devices.
    • For IT: Eliminates the need to manage software on endpoints, saving time.
    • For HR & Management: Provides monitoring without invasive tools, maintaining employee trust.
  4. Multi-Vendor Firewall Compatibility
    • What It Does: Supports top firewall brands like Palo Alto, Cisco, Fortigate, and SonicWall.
    • Why It’s a Game-Changer: Unifies reporting in mixed IT environments, streamlining management.
    • For IT: Standardizes reporting across vendors, simplifying your workflow.
    • For Management: Ensures consistent, clear reports regardless of firewall setup.
  5. Scalable for Any Organization
    • What It Does: Handles large data volumes effortlessly, growing with your needs.
    • Why It’s a Game-Changer: Keeps performance strong as your workforce expands.
    • For IT: Manages high-throughput environments without slowdowns.
    • For Management: Delivers reliable insights at every stage of growth.

Cyfin in Action

Consider this scenario: A department manager suspects excessive personal web use during work hours. The IT team pulls logs from their firewall, but what they get is a flood of technical entries—tens of thousands of lines including Windows telemetry, antivirus updates, background ad tracking, and cloud syncs.

With Cyfin, that same data is distilled into a clear, chronological report showing actual employee-initiated browsing—highlighting visits to shopping sites, video streaming platforms, and news articles. HR receives a clean PDF report that supports a productive and well-informed conversation with the employee in question.

Conclusion

Cyfin solves a problem that even seasoned IT professionals struggle with: how to turn raw firewall data into meaningful insights about employee web behavior. Its ability to separate human action from machine noise makes it an invaluable tool not just for IT, but for HR, Legal, and Management teams as well.

When accurate visibility into employee online activity matters, Cyfin is the solution that delivers clarity from chaos.

Reporting Issue

Issue

Report returns with zero visits

Resolution

  • Repair and download the latest list
    • Screen Path (‘Categorization – URL list – Repair’ and click the ‘Submit’ button)
  • Delete imported data with issue
    • Screen Path (‘Data Management – Report Database – Delete – Manual’) 
  • Re-import data with issue
    • Screen Path (‘Data Management – Report Database – Import – Manual’)

If this didn’t resolve the issue please call or email support

  • 321-953-5351 ext. 4
  • support@wavecrest.net

Microsoft Defender Data Source Settings

To configure access for Cyfin to Microsoft 365 Defender you will have to create a new Azure Application registration, this will again return Oauth tokens with access to the Microsoft 365 Defender API

The procedure to create an application is found on the below link:

Create a new Azure Application

When giving the application the API permissions described in the documentation (Incident.Read.All) it will only grant access to read Incidents from 365 Defender and nothing else in the Azure Domain.

After the application has been created, it should contain 3 values that you need to apply to the module configuration.

These values are:

  • Client ID
  • Tenant ID
  • Client Secret

In Cyfin go to Data Management -> Setup and select Microsoft Defender

Now input the 3 values gathered from the previous steps

Microsoft 365 Reporting Prerequisites

To use Cyfin 365 reporting you need to enable Audit Log Search and register an application in Azure AD.

Once this application is registered note the Application (client) ID and the Directory (tenant) ID. Then configure the authentication in the Certificates & Secrets section from the link provided above.

Configure Cyfin

  1. Navigate to ‘Data Management – Log Data Source – Setup’
  2. Select ‘Create New’ from the configuration dropdown and click ‘Next’
  3. Click Office365 from the listed options
  4. Fill in the appropriate fields with information gathered from the prerequisites. See below image.
  5. Once completed continue to the next screen and name your configuration then click next once more to save.
Microsoft 365 Reporting
Microsoft 365 Cyfin Configuration

What information do you require in your Cyfin reports?

If you want all Web traffic detail, enable SSL inspection on your firewall to create raw logs containing full URLs, content type, user agent, and more. Then when your logs are imported into or transferred via syslog to Cyfin, you can take full advantage of Cyfin’s high precision algorithms that increase report accuracy and detail.

Configuring Data Sources

In Cyfin version 9.3.1, the Log Data Source Setup wizard has been redesigned to improve the configuration of the product to locate and read your Web-use data when it is syslog data, log files, or database logs. The system will analyze your data to detect the data source format and present the most suitable data types. This allows you to select the best data type from the list and ensures that you get the best match available.

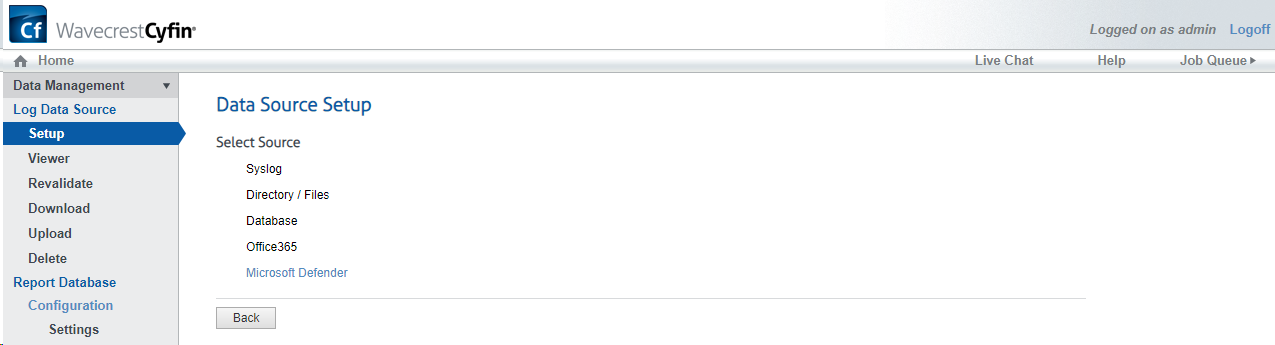
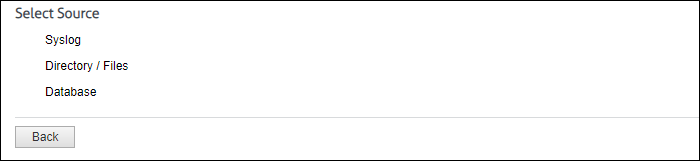
You will be able to select from the following data sources: syslog, directory-based, and database.

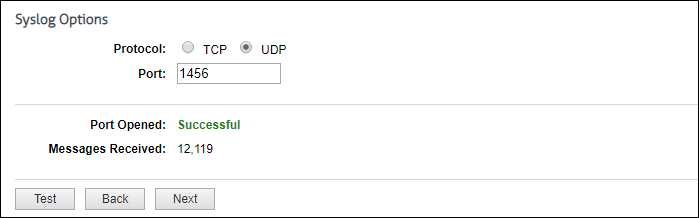
For syslog data, select the Internet protocol you want to use, and enter the listening port number. Click Test to start collecting data. If this is successful, you will see the number of messages received incrementing. Click Stop and then Next to continue.

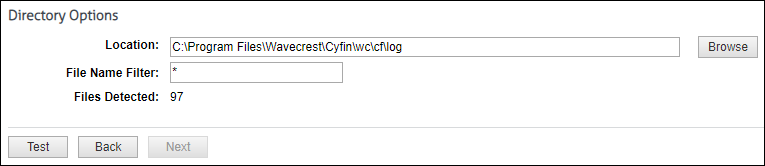
For directory-based or log file data, specify the directory location of your data files. You can also enter a file name with an asterisk to filter your log files, e.g., proxy*.txt. Click Test to display the number of files found. Click Next.

The Data Source Type page is displayed.

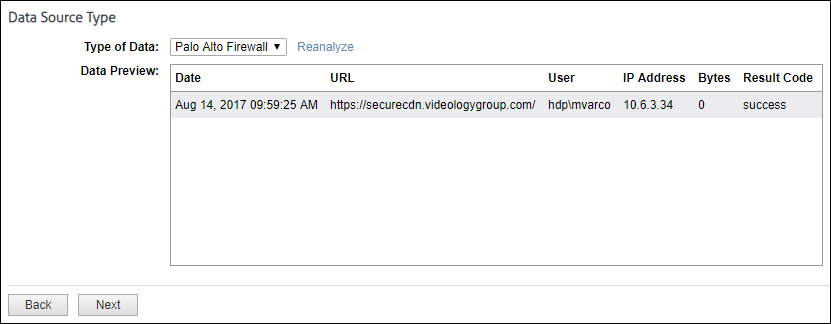
The Type of Data drop-down field will display multiple matches. As you select a data type, the data format will be shown in the Data Preview box. Look closely at the data fields to ensure that they are correct or complete.

  • You may see incomplete data, for example, if you were expecting a user name and it is missing. Click Reanalyze to see another record sample.
  • If you need to refresh the data for any reason or are still in the process of receiving syslog messages, click Reanalyze and then select the data source type again.
  • If your firewall is not in the drop-down field, but the data of another completely matches and is in the correct columns, you may select that firewall even though it has a different name. Some firewalls share common data formats.
  • If no matches are found, all syslog and directory data types will become available in the drop-down field. You can select a different data type from the field to complete the configuration process and return at a later time to change it.
  • It is easy to add new data sources to our extensive library. If you have a new data source, need assistance with multiple matches, or have no matching files, just contact Technical Support.

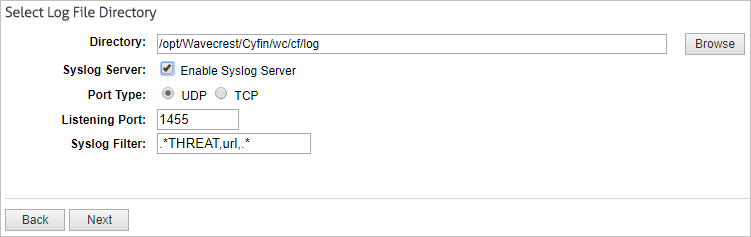
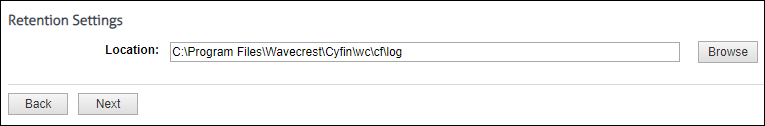
Also for Syslog, you can specify a location in which to keep a local copy of your data.

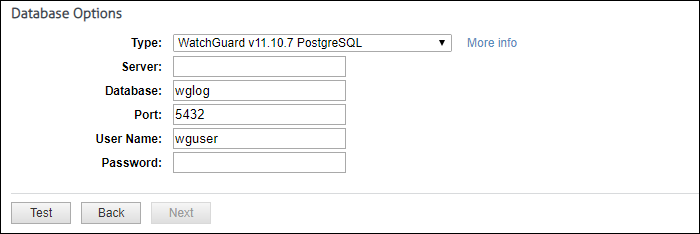
For database data, the system loads and populates the Type field with database data types. The “More info” link provides setup information on your specific database. Select the type of database and complete the remaining fields. Some fields will be populated with default values.

The last step is to give the data source configuration a name. This is helpful for identification purposes, especially if you add more data source configurations later.

If you have any questions, please contact Technical Support at (321) 953-5351, Ext. 4 or support@wavecrest.net.

Changing the Interactive Reports password

When an Interactive report is sent via e-mail to a user, the user will receive a link (or two links depending on server settings) to the report. The user must enter a password to access the report.

  • The default password is password.
  • This password should be changed on the Settings – Reports – Interactive Reports screen.
  • The password must be used by anyone trying to access an Interactive report.

Cyfin VM syslog port

In Cyfin VM, when configuring the Cyfin Syslog Server port, the port number must be greater than 1000. Port numbers 1000 and below are blocked on the VM. Follow the steps below to change the port number if it is below 1000.

The steps below apply to version 9.3.0. However, follow the same guidelines for version 9.3.1 and later.

  1. In Cyfin VM, go to Data Management – Log Data Source – Setup.
  2. Select your existing syslog log file configuration and click Next.
  3. On the Modify confirmation screen, select the check box to indicate that you understand the statements on the screen. Click Next.
  4. On the Select Log File Type screen, your log file type is already selected. Click Next.
  5. If an Information screen appears, click Next.

  1. On the Select Log File Directory screen, change the number in the Listening Port field to one that is greater than 1000. Click Next.
  2. Click Next on the following screens to complete the validation process.

Note: Steps for v943 and older are shown in video below

Additional Resources:

Configuring log forwarding from Palo Alto Panorama to Cyfin Syslog Server

With your firewalls already forwarding logs to Panorama, the high-level steps to forward Palo Alto Panorama logs to Cyfin Syslog Server include the following:

  • Configure the server profile that defines how Panorama and Log Collectors connect to the external service, that is, Cyfin Syslog Server.
  • Assign the server profile to the log settings of Panorama and to Collector Groups.

STEP 1: Configure a server profile for Cyfin Syslog Server that will receive log information.

  1. Select Panorama – Server Profiles and select Syslog.
  2. Configure the syslog server profile.

STEP 2: Configure destinations for:

  • Logs that the Panorama management server and Log Collectors generate.
  • Firewall logs that a Panorama virtual appliance in Legacy mode collects.
  1. Select Panorama – Log Settings.
  2. Add one or more match list profiles for each log type.

The profiles specify log query filters, forwarding destinations, and automatic actions such as tagging. For each match list profile:

    1. Enter a Name to identify the profile.
    2. Select the Log Type.
    3. In the Filter drop-down field, select Filter Builder. Specify the following and then Add each query:
      • Connector logic (and/or)
      • Log Attribute
      • Operator to define inclusion or exclusion logic
      • Attribute Value for the query to match
    4. Add the server profile you configured for Cyfin Syslog Server.
    5. Click OK to save the profile.

STEP 3: Configure destinations for firewall logs that Log Collectors receive.

  1. Select Panorama – Collector Groups and edit the Collector Group that receives the firewall logs.
  2. Select Collector Log Forwarding and see step Add one or more match list profiles for each log type above.
  3. Click OK to save your changes to the Collector Group.

STEP 4: Commit and verify your configuration changes.

  1. Select Commit – Commit and Push to commit your changes to Panorama and push the changes to device groups, templates, and Collector Groups.
  2. Verify that Cyfin Syslog Server is receiving the log information in one of the following ways:
    • In the log folder, check for the syslog.txt file.
    • In Cyfin, go to Data Management – Log Data Source – Viewer to check for syslog.txt.

Additional Resources:

E-mailing reports with an Office 365 account

If the administrator’s e-mail address is an Office 365 account and you are experiencing an issue when e-mailing a report from Reports – Manager, Option 2 in the following article may resolve the issue:

How to set up a multifunction device or application to send email using Office 365

In the Step-by-step instructions for direct send section of the article, note the MX record POINTS TO ADDRESS value, and enter it in the Server Name field on the Settings – E-Mail screen in the product. Run the report again with the E-Mail Report Delivery option.

If you have any questions, please contact Technical Support at (321) 953-5351, Ext. 4 or support@wavecrest.net.