The Session Settings Screen allows you to customize, run, and analyze your session algorithm against specific log file configurations and defined timespans. Built with adaptability in mind, you can modify session algorithm parameters to better align with the unique requirements of any customer environment.
Go to Settings – Reports – Sessions. The Session screen is displayed
Session Analyzer
- To manually run the session algorithm go to the Session Analyzer section
- Select Log File Configuration: Use the dropdown to select the log files you’d like to include in your analysis.
- Define Your Timespan: Using the calendar tool, select your desired start and end dates and times.
- Press the button labeled ‘Analyze’ on the screen to initiate the session algorithm.

Session Analyzer Configuration
If you’re familiar with the specifics of the session algorithm and wish to fine-tune it, use the input boxes to adjust the default parameters. If unsure, it’s recommended to consult the definition below or contact our support team for assistance.
- To override the system defaults use the below input boxes to adjust the default parameters.
- Press the button labeled ‘Update Configuration’ to apply Session algorithm parameter changes.
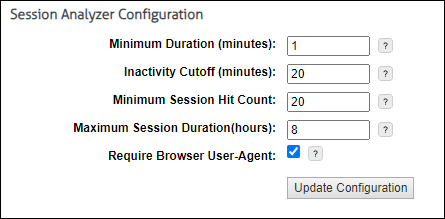
Session Parameter Definitions
- Minimum Duration (minutes): The least amount of continuous Web activity to a particular Application/Site required to constitute a session.
- Inactivity Cutoff (minutes): The amount of time since the last activity to an Application/Site for a session to be considered complete. Future activity will start a new Session.
- Minimum Session Hit Count: The minimum amount of Web activity (log hits) required to each Application/Site for the activity to constitute a Session.
- Maximum Session Duration(hours): A hard limit in hours for acitvity to single Application/Site.
- Required Browser User-Agent: When enabled Log records containing known browser types will be analyzed.
- Notes:
- Keeping the checkbox enabled allows for a more refined and relevant session analysis by focusing on known browser types.
- Users who wish to view all log records, regardless of browser type, should disable the checkbox. However, please note that disabling this option will affect the accuracy of the session analysis.
- Disabling this checkbox might be necessary if SSL inspection is not enabled on your firewall. Without SSL inspection, the session analysis may not only be inaccurate but could also return without any results because the user agent field would be empty.
- Notes: